Numbers that point at watches.
Every figure on this page is one click from the pieces it came from. A report you cannot open is just an opinion with a chart on it.
Where the money is standing still.
Your stock sorted by how long it has been sitting, and what each band is costing you. The bar below is the whole book. The thin line under it is the cost, and it is still moving while you read this.
Holding cost accrues continuously against the aged band.
Press a number. Meet the watches.
No report on this page is a dead end. Every band, brand and channel opens into the actual pieces underneath it, with what each one cost and what it is doing to you per day.
 Rolex Yacht-Master 168622
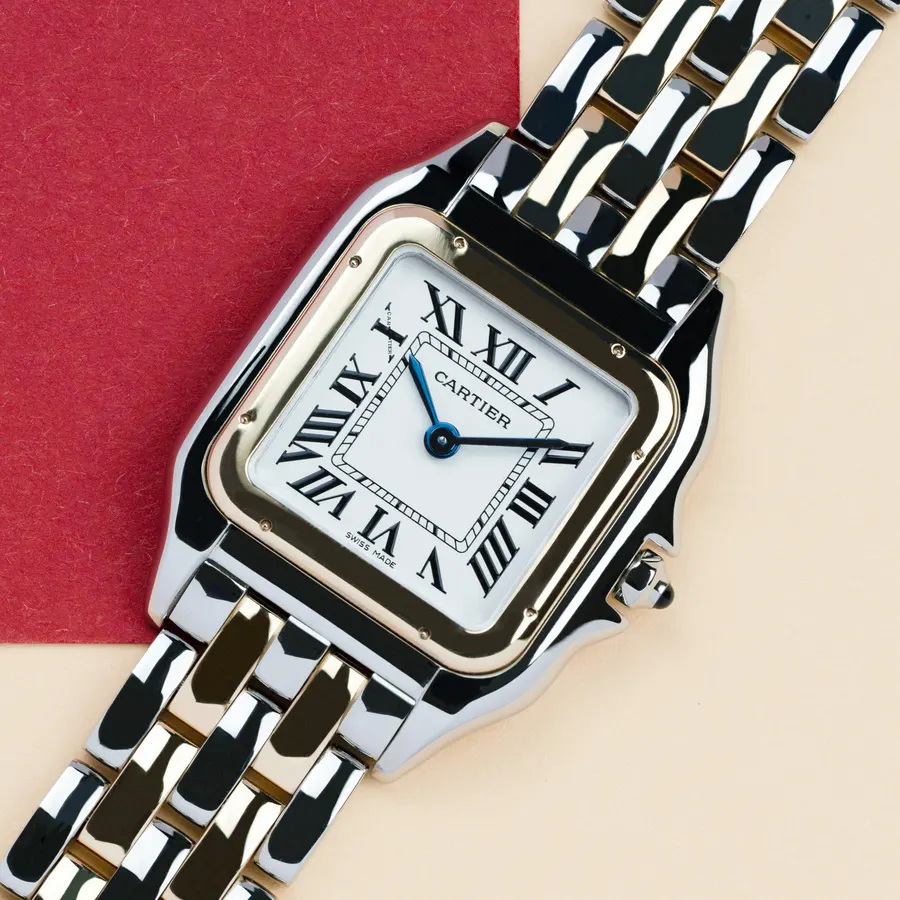 Cartier Panthère W2PN0019
 Rolex Datejust 68273
Where the money actually came from.
Volume and margin almost never sit in the same channel. The one you spend most time on is rarely the one paying for your year.
Chrono24 moved seventeen pieces and kept the least of any channel. Your own storefront moved twelve and kept the most. That is not an argument for leaving Chrono24, it is an argument for knowing which one is paying for your year.
Between the margin you made and the margin you kept.
Every cost lands on the piece that caused it, so this is not an estimate reconstructed at year end. It is the same number your reports were already using.
Marketplace commission is the only row here at zero. Every other cost in this waterfall is one you were always going to pay. That one is a choice we made about how this company earns.
Example workspace. Your own costs are whatever you booked against your own pieces.
Which brand actually pays you.
The one you sell most of is rarely the one that earns most, and almost never the one that turns fastest. Change the measure and watch the order change with it.
Rolex earns the most and Tudor turns the fastest. Patek earns well and sits for five months doing it. All three of those are true at once, which is the entire problem with a single leaderboard.
Your year has a shape.
Detected from your own sales, not from an industry average. Who buys, and when they actually buy, so the stock you are holding in August is the stock November wants.
of your year, in three months. Gifting buyers arrive in December and pay the least time-adjusted attention to price. Investors buy in the first quarter and negotiate hardest.
Detected from your own sales history.